| One Stop for Testing and Tools |
|
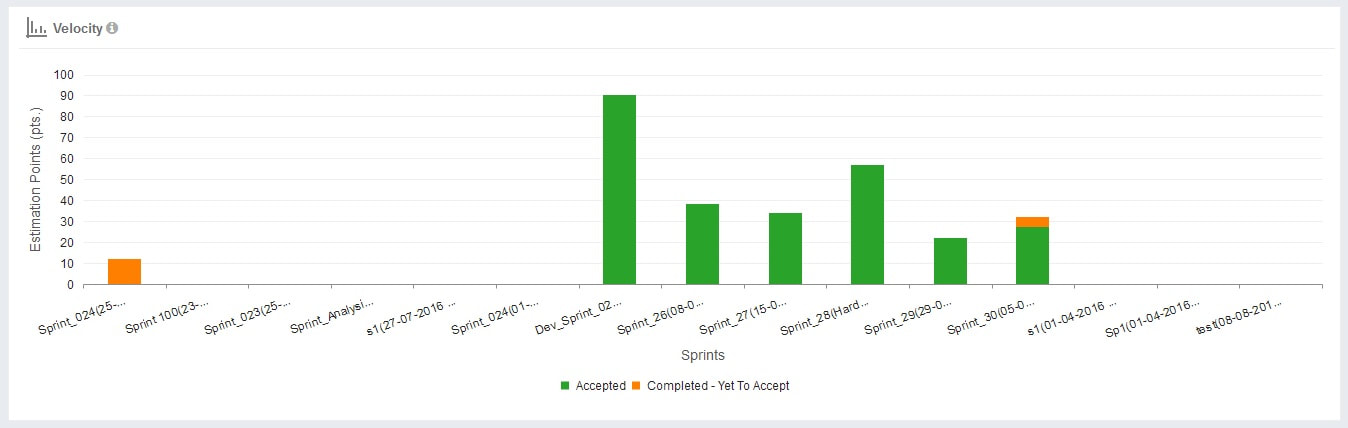
Velocity
The Velocity indicates the amount of value delivered in each sprint, enabling you to predict the amount of work the team can get done in future sprints. It is useful during your sprint planning meetings, to help you decide how much work you can feasibly commit to. The team's velocity can be estimated based upon the total estimate (for all completed stories) for each recent sprint. This isn't an exact science — looking at several sprints will help you to get a feel for the trend. For each sprint, the Velocity Chart shows the sum of the Estimates for complete and incomplete stories. Estimates can be based on story points, business value, hours, issue count, or any numeric field of your choice.
The Velocity indicates the amount of value delivered in each sprint, enabling you to predict the amount of work the team can get done in future sprints. It is useful during your sprint planning meetings, to help you decide how much work you can feasibly commit to. The team's velocity can be estimated based upon the total estimate (for all completed stories) for each recent sprint. This isn't an exact science — looking at several sprints will help you to get a feel for the trend. For each sprint, the Velocity Chart shows the sum of the Estimates for complete and incomplete stories. Estimates can be based on story points, business value, hours, issue count, or any numeric field of your choice.
Importance of velocity
Velocity is a key feedback mechanism for the Team. It helps the team to measure whether process changes it makes are improving its productivity or reducing it. While a Team's velocity will oscillate from Sprint to Sprint, over time, a well-functioning Scrum Team's velocity should steadily trend upward by roughly 10% each Sprint.
It also facilitates very accurate forecasting of how many stories a Team can do in a Sprint. For forecasting purposes the average of the last three Sprint's Velocity should be used. Of course, this means it takes three Sprints of experience for a Team to determine its Velocity accurately, which can sometimes be difficult to explain to impatient stakeholders. Without Velocity, Release Planning is impossible. By knowing Velocity, a Product Owner can figure out how many Sprints it will take the Team to achieve a desired level of functionality that can then be shipped. Depending on the length of the Sprint, the Product owner can fix a date for the release.
The velocity metric is used to reconcile velocity changes - an increase in accepted bugs or chores can explain a dip in velocity. It’s also helpful for managing technical debt: keeping chores at a steady level ensures a focus on keeping your systems and code in peak condition. There are several things you can do with a velocity chart:
Why do we need velocity?
Can an incomplete user story be counted in velocity?
No, you shouldn't. Incomplete is undone. Velocity is about finished, delivered user stories. Here are some reasons why you shouldn't count incomplete user stories:
Determining team velocity
An existing team can determine its velocity by completing the following steps:
Most teams determine their baseline velocity within about three iterations.
How to estimate sprint velocityIn order to estimate what work can be completed in the future, you need to measure the work that has previously been done. To get a good average measurement of work that has been done, plan to review the previous three sprints.
In the following example, we will use story points to measure the amount of work completed in each sprint. A story point is a measurement used by Agile development teams to estimate how much effort and time it will take to complete a user story.
Step 1: Count how many user story points are completed in each sprintAt the end of a sprint, add up how many story points the team completed.
For example, assume that in sprint 1:
Sprint 1: 3 user stories x 8 story points = 24
Sprint 2: 4 user stories x 8 story points = 32
Sprint 3: 5 user stories x 8 story points = 40
Total = 96
So, your average sprint velocity is 96 ÷ 3 = 32.
You can now base the amount of work to be done in future sprints on the average of 32 story points. If you have 160 story points remaining to be completed in the project, you can assume that your team will need another five sprints to complete the project.
However, this is just an estimate and is accurate only if variables such as team size and project complexity and scope remain constant. Your teams will experience fluctuations from sprint to sprint. But the sprint velocity estimation is a good starting point to help you determine how much work your team can do.
If your team is new to Agile development, you won’t have any previous sprints to look at. As part of your sprint velocity estimation to-do list, you’ll have to complete a couple of sprints while tracking how many story points are completed in each. Then you will have some useful data that will help calculate an average.
Velocity is a key feedback mechanism for the Team. It helps the team to measure whether process changes it makes are improving its productivity or reducing it. While a Team's velocity will oscillate from Sprint to Sprint, over time, a well-functioning Scrum Team's velocity should steadily trend upward by roughly 10% each Sprint.
It also facilitates very accurate forecasting of how many stories a Team can do in a Sprint. For forecasting purposes the average of the last three Sprint's Velocity should be used. Of course, this means it takes three Sprints of experience for a Team to determine its Velocity accurately, which can sometimes be difficult to explain to impatient stakeholders. Without Velocity, Release Planning is impossible. By knowing Velocity, a Product Owner can figure out how many Sprints it will take the Team to achieve a desired level of functionality that can then be shipped. Depending on the length of the Sprint, the Product owner can fix a date for the release.
The velocity metric is used to reconcile velocity changes - an increase in accepted bugs or chores can explain a dip in velocity. It’s also helpful for managing technical debt: keeping chores at a steady level ensures a focus on keeping your systems and code in peak condition. There are several things you can do with a velocity chart:
- Monitor overall project health
- Understand velocity trends
- Track volatility
Why do we need velocity?
- Predict how much scope can be delivered by a specific date
- Predict a date for a fixed amount of scope to be delivered
- Understand our limits while defining the amount of scope we will commit for a sprint
Can an incomplete user story be counted in velocity?
No, you shouldn't. Incomplete is undone. Velocity is about finished, delivered user stories. Here are some reasons why you shouldn't count incomplete user stories:
- We can't really figure out how much is ready and how much is not; it will be a wild guess.
- We may be led by a false sense of accuracy, due to the use of fractional numbers.
- Incomplete means the user story still has no value for the customer.
Determining team velocity
An existing team can determine its velocity by completing the following steps:
- Agree on a project iteration (for example, 10 workdays).
- Gather a list of what the team completed in the previous 10 work days.
- List the work completed in story points to establish their sum and corresponding velocity value.
- Plan to deliver this number of story points in the team's first iteration.
- Add or remove points in the next iteration based on whether the team completes the targeted number of story points.
Most teams determine their baseline velocity within about three iterations.
How to estimate sprint velocityIn order to estimate what work can be completed in the future, you need to measure the work that has previously been done. To get a good average measurement of work that has been done, plan to review the previous three sprints.
In the following example, we will use story points to measure the amount of work completed in each sprint. A story point is a measurement used by Agile development teams to estimate how much effort and time it will take to complete a user story.
Step 1: Count how many user story points are completed in each sprintAt the end of a sprint, add up how many story points the team completed.
For example, assume that in sprint 1:
- The team committed to completing five user stories.
- Each user story had eight story points for a total of 40 story points.
- The team completed three of the five user stories.
- The team committed to seven user stories (including the two that were not completed in sprint 1).
- Each user story had eight story points for a total of 56 story points.
- The team completed four of the seven user stories.
- The team committed to nine user stories.
- Each user story had eight story points for a total of 72 story points.
- The team completed five of the nine user stories.
Sprint 1: 3 user stories x 8 story points = 24
Sprint 2: 4 user stories x 8 story points = 32
Sprint 3: 5 user stories x 8 story points = 40
Total = 96
So, your average sprint velocity is 96 ÷ 3 = 32.
You can now base the amount of work to be done in future sprints on the average of 32 story points. If you have 160 story points remaining to be completed in the project, you can assume that your team will need another five sprints to complete the project.
However, this is just an estimate and is accurate only if variables such as team size and project complexity and scope remain constant. Your teams will experience fluctuations from sprint to sprint. But the sprint velocity estimation is a good starting point to help you determine how much work your team can do.
If your team is new to Agile development, you won’t have any previous sprints to look at. As part of your sprint velocity estimation to-do list, you’ll have to complete a couple of sprints while tracking how many story points are completed in each. Then you will have some useful data that will help calculate an average.
